| Question 46 You have five sales regions. Each region is assigned a single salesperson. You have an imported dataset that has a dynamic row-level security (RLS) role named Sales. The Sales role filters sales transaction data by salesperson. Salespeople must see only the data from their region. You publish the dataset to powerbi.com, set RLS role membership, and distribute the dataset and related reports to the salespeople. A salesperson reports that she believes she should see more data. You need to verify what data the salesperson currently sees. What should you do? A. Use the Test as role option to view data as the salesperson’s user account. B. Use the Test as role option to view data as the Sales role. C. Instruct the salesperson to open the report in Microsoft Power BI Desktop. D. Filter the data in the reports to match the intended logic in the filter on the sales transaction table. |
46. Click here to View Answer
Answer: B
Validating the role within the Power BI service
You can validate that the role you defined is working correctly in the Power BI service by testing the role.
1. Select More options (…) next to the role.
2. Select Test data as role.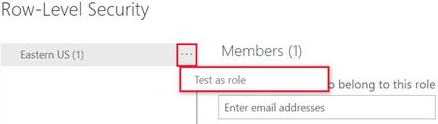
You’ll see reports that are available for this role. Dashboards aren’t shown in this view. In the page header, the role being applied is shown.
Reference:
https://docs.microsoft.com/en-us/power-bi/enterprise/service-admin-rls
| Question 47 HOTSPOT You are creating a Microsoft Power BI data model that has the tables shown in the following table. 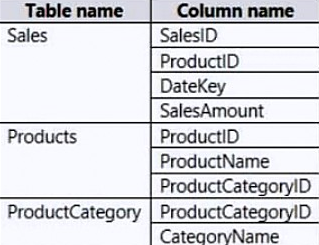 The Products table is related to the ProductCategory table through the ProductCategoryID column. Each product has one product category. You need to ensure that you can analyze sales by product category. How should you configure the relationship from ProductCategory to Products? To answer, select the appropriate options in the answer area. NOTE: Each correct selection is worth one point. Hot Area: 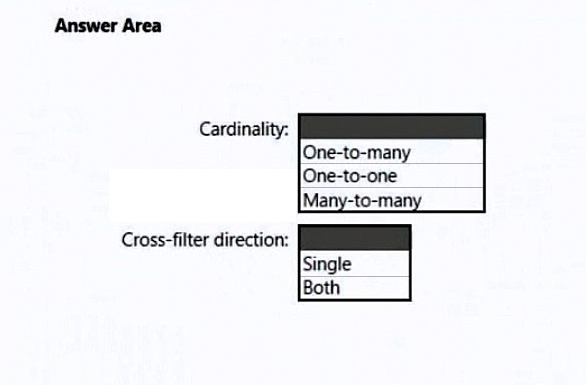 |
47. Click here to View Answer
Answer:
None
Box 1: One-to-many –
The one-to-many and many-to-one cardinality options are essentially the same, and they’re also the most common cardinality types.
Incorrect: A many-to-many relationship means both columns can contain duplicate values. This cardinality type is infrequently used. It’s typically useful when designing complex model requirements. You can use it to relate many-to-many facts or to relate higher grain facts. For example, when sales target facts are stored at product category level and the product dimension table is stored at product level.
Box 2: Single –
Incorrect:
Bear in mind that bi-directional relationships can impact negatively on performance. Further, attempting to configure a bi-directional relationship could result in ambiguous filter propagation paths. In this case, Power BI Desktop may fail to commit the relationship change and will alert you with an error message.
Reference:
https://docs.microsoft.com/en-us/power-bi/transform-model/desktop-relationships-understand
| Question 48 DRAG DROP You have a Power BI workspace that contains a single-page report named Sales. You need to add all the visuals from Sales to a dashboard. The solution must ensure that additional visuals added to the page are added automatically to the dashboard. Which three actions should you perform in sequence? To answer, move the appropriate actions from the list of actions to the answer area and arrange them in the correct order. Select and Place: 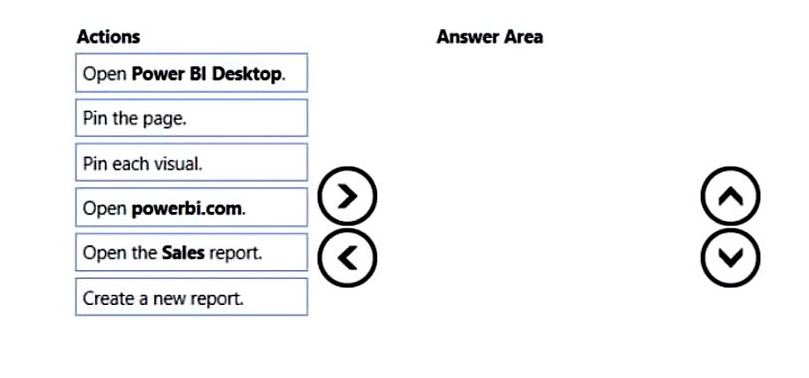 |
48. Click here to View Answer
Answer:
None
An entire report page can be pinned to a dashboard, which is called pinning a live tile. It’s called a live tile because you can interact with the tile on the dashboard.
Unlike with individual visualization tiles, changes made in the report are automatically synced with the dashboard.
Step 2: Open the Sales report –
Step 3: Pin the page.
1. Open a report in Editing view.
2. With no visualizations selected, from the menu bar, select Pin to a dashboard.
3. Pin the tile to an existing dashboard or to a new dashboard. Notice the highlighted text: Pin live page enables changes to reports to appear in the dashboard tile when the page is refreshed.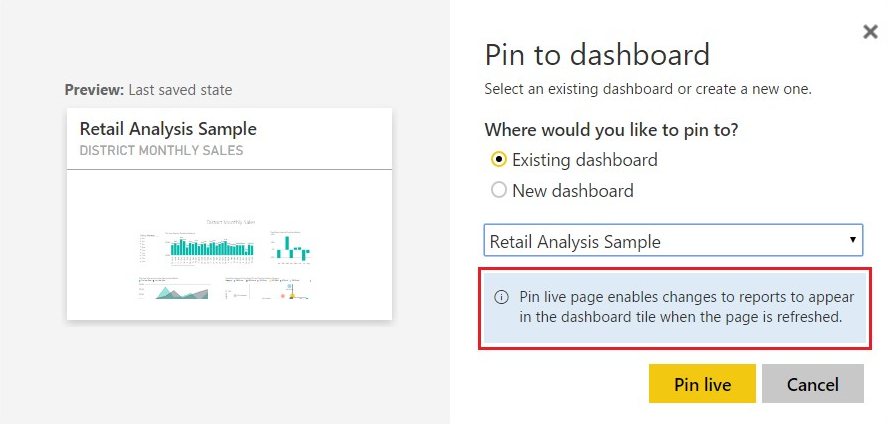
4. Select Pin live. A Success message (near the top right corner) lets you know the page was added, as a tile, to your dashboard.
Reference:
https://docs.microsoft.com/en-us/power-bi/create-reports/service-dashboard-pin-live-tile-from-report
| Question 49 HOTSPOT You create a Power BI dataset that contains the table shown in the following exhibit. 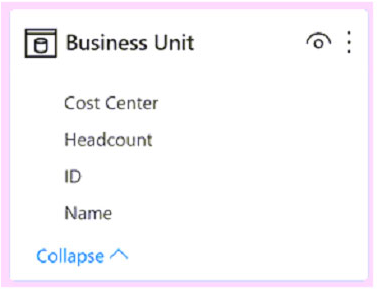 You need to make the table available as an organizational data type in Microsoft Excel. How should you configure the properties of the table? To answer, select the appropriate options in the answer area. NOTE: Each correct selection is worth one point. Hot Area: 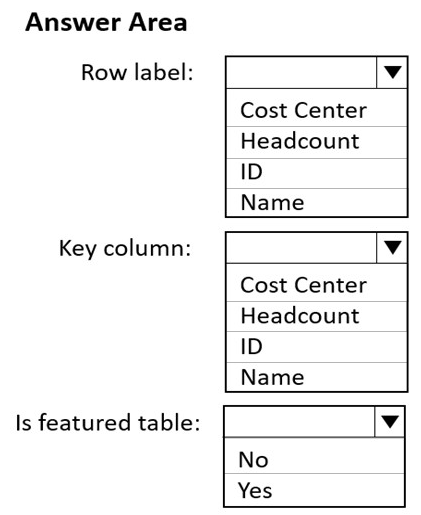 |
49. Click here to View Answer
Answer:
None
Box 1: Cost Center –
The Row label field value is used in Excel so users can easily identify the row. It appears as the cell value for a linked cell, in the Data Selector pane, and in the
Information card.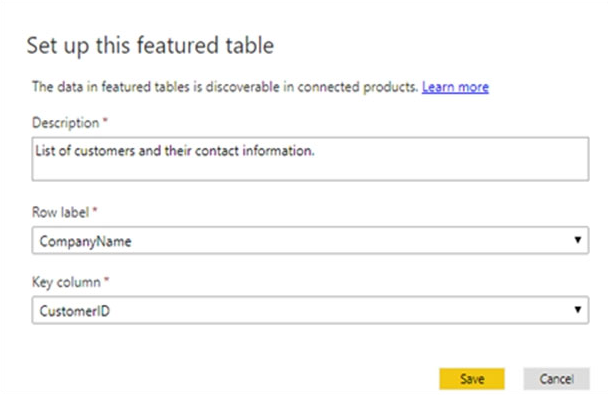
Box 2: ID –
The Key column field value provides the unique ID for the row. This value enables Excel to link a cell to a specific row in the table.
Box 3: Yes –
In the Data Types Gallery in Excel, your users can find data from featured tables in your Power BI datasets.
Reference:
https://docs.microsoft.com/en-us/power-bi/collaborate-share/service-create-excel-featured-tables
| Question 50 For the sales department at your company, you publish a Power BI report that imports data from a Microsoft Excel file located in a Microsoft SharePoint folder. The data model contains several measures. You need to create a Power BI report from the existing data. The solution must minimize development effort. Which type of data source should you use? A. Power BI dataset B. a SharePoint folder C. Power BI dataflows D. an Excel workbook |
50. Click here to View Answer
Answer: B
Connect to a SharePoint folder from Power Query Desktop
To connect to a SharePoint folder:
1. From Get Data, select SharePoint folder.
2. Paste the SharePoint site URL you copied in Determine the site URL to the Site URL text box in the SharePoint folder dialog box. In this example, the site URL is https://contoso.sharepoint.com/marketing/data. If the site URL you enter is invalid, a warning icon. warning icon will appear next to the URL text box.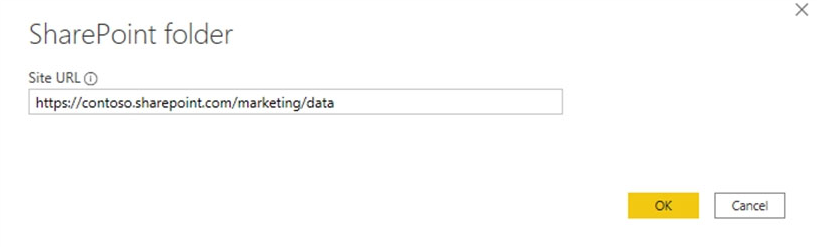
Select OK to continue.
3. If this is the first time you’ve visited this site address, select the appropriate authentication method. Enter your credentials and choose which level to apply these settings to. Then select Connect.
4. When you select the SharePoint folder you want to use, the file information about all of the files in that SharePoint folder are displayed. In addition, file information about any files in any subfolders is also displayed.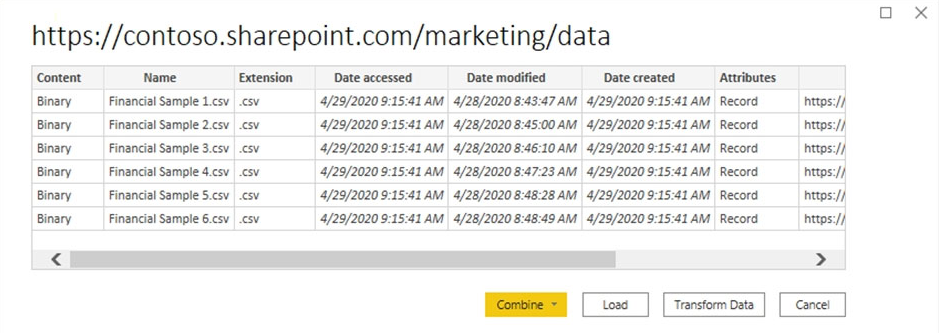
5. Etc.
Reference:
https://docs.microsoft.com/en-us/power-query/connectors/sharepointfolder