| Question 51 DRAG DROP Once the profit and loss dataset is created, which four actions should you perform in sequence to ensure that the business unit analysts see the appropriate profit and loss data? To answer, move the appropriate actions from the list of actions to the answer area and arrange them in the correct order. Select and Place: 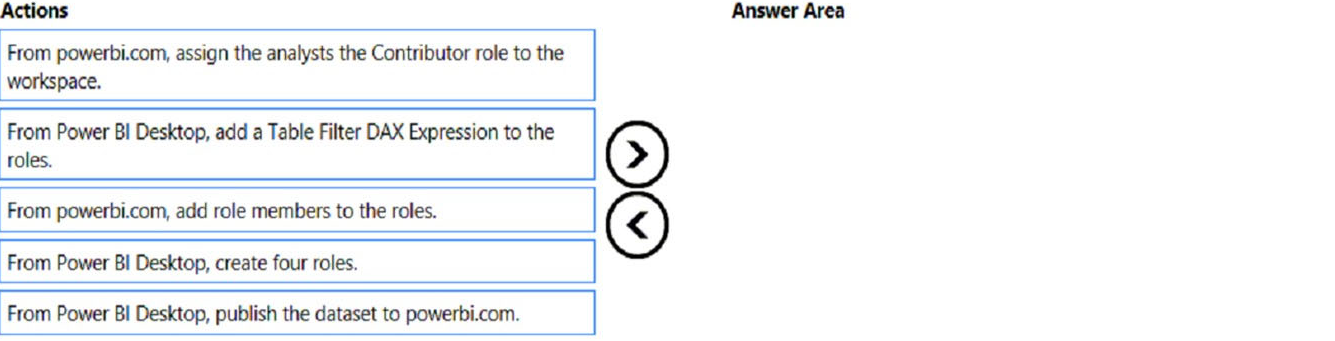 |
51. Click here to View Answer
Answer:
None
Step 1: From BI Desktop, create four roles
You can define roles and rules within Power BI Desktop.
Step 2: From BI Desktop, add a Table Filter DAX Expression to the roles.
To define security roles, follow these steps.
1. From the Modeling tab, select Manage Roles.
2. Select Manage Roles
3. From the Manage roles window, select Create.
4. Select Create
5. Under Roles, provide a name for the role.
6. Under Tables, select the table to which you want to apply a DAX rule.
7. In the Table filter DAX expression box, enter the DAX expressions. This expression returns a value of true or false. For example: [Entity ID] = Value.
After you’ve created the DAX expression, select the checkmark above the expression box to validate the expression.
8. Select Save.
Step 3: From powerbi.com, add role members to the roles.
You can’t assign users to a role within Power BI Desktop. You assign them in the Power BI service.
Step 4: From BI Desktop, publish the dataset to powerbi.com
Now that you’re done validating the roles in Power BI Desktop, go ahead and publish your report to the Power BI service.
Reference:
https://docs.microsoft.com/en-us/power-bi/enterprise/service-admin-rls
| Question 52 You have a CSV file that contains user complaints. The file contains a column named Logged. Logged contains the date and time each complaint occurred. The data in Logged is in the following format: 2018-12-31 at 08:59. You need to be able to analyze the complaints by the logged date and use a built-in date hierarchy. What should you do? A. Change the data type of the Logged column to Date. B. Split the Logged column by using at as the delimiter. C. Add a conditional column that outputs 2018 if the Logged column starts with 2018 and set the data type of the new column to Whole Number. D. Apply the Parse function from the Date transformations options to the Logged column. |
52. Click here to View Answer
Answer: C
| Question 53 HOTSPOT You have a table that contains the following three columns: City Total Sales Occupation You need to create a key influencers visualization as shown in the exhibit. (Click the Exhibit tab.) 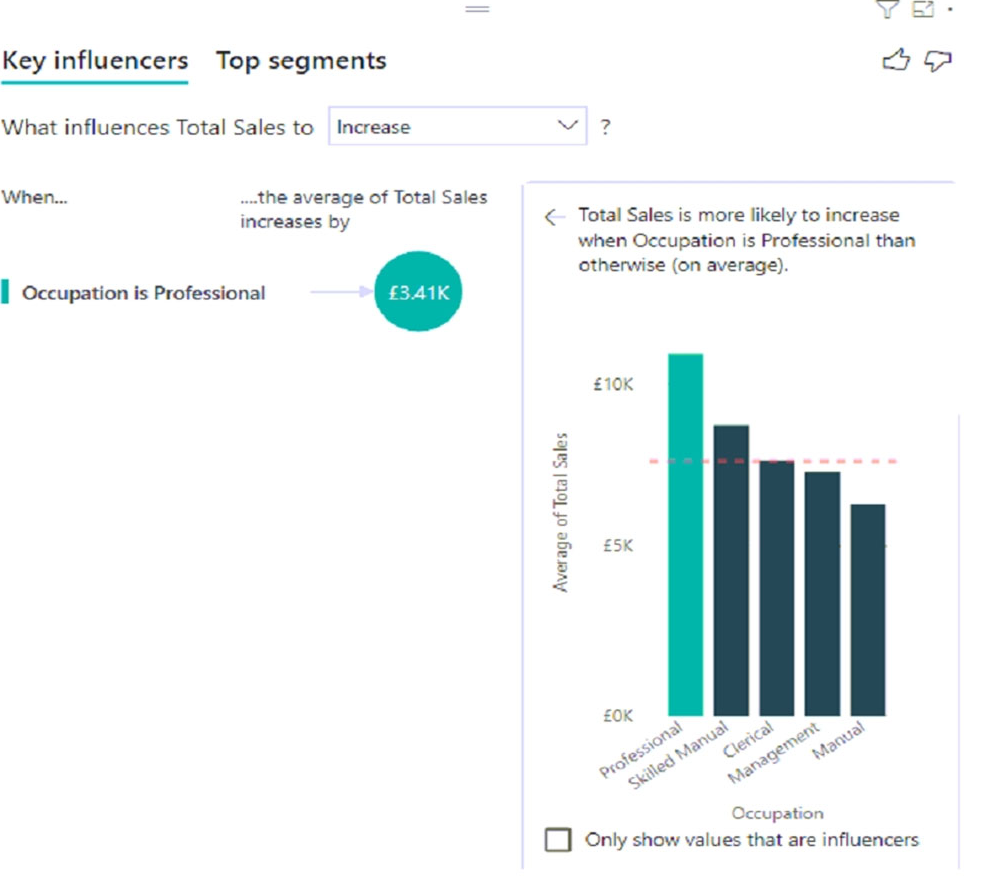 How should you configure the visualization? To answer, select the appropriate options in the answer area. NOTE: Each correct selection is worth one point. Hot Area: 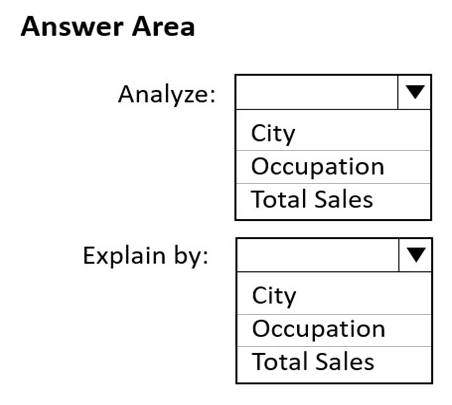 |
53. Click here to View Answer
Answer:
None
Box 1: Total Sales –
The key influencers visual helps you understand the factors that drive a metric you’re interested in, here Total Sales. It analyzes your data, ranks the factors that matter, and displays them as key influencers.
Box 2: Occupation –
Measures and summarized columns are automatically analyzed at the level of the Explain by fields used.
Reference:
https://docs.microsoft.com/en-us/power-bi/visuals/power-bi-visualization-influencers
| Question 54 You build a report to help the sales team understand its performance and the drivers of sales. The team needs to have a single visualization to identify which factors affect success. Which type of visualization should you use? A. Key influencers B. Line and clustered column chart C. Q&A D. Funnel |
54. Click here to View Answer
Answer: A
The key influencers visual helps you understand the factors that drive a metric you’re interested in. It analyzes your data, ranks the factors that matter, and displays them as key influencers. For example, suppose you want to figure out what influences employee turnover, which is also known as churn. One factor might be employment contract length, and another factor might be commute time.
When to use key influencers.
The key influencers visual is a great choice if you want to:
See which factors affect the metric being analyzed.
Contrast the relative importance of these factors. For example, do short-term contracts affect churn more than long-term contracts?
Reference:
https://docs.microsoft.com/en-us/power-bi/visuals/power-bi-visualization-influencers
| Question 55 HOTSPOT You need to create a visual as shown in the following exhibit. 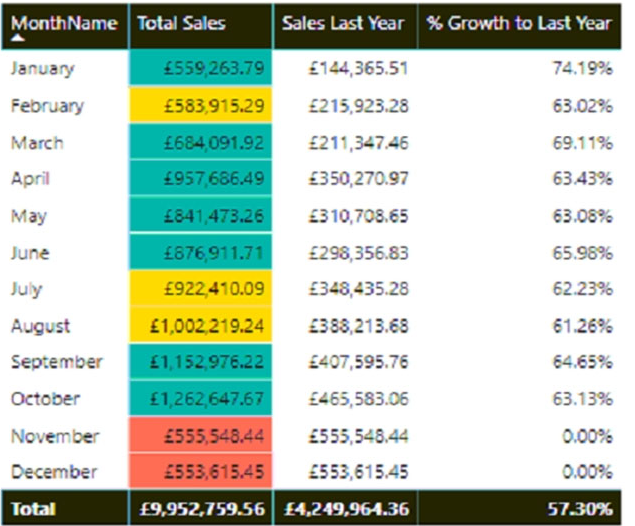 The indicator color for Total Sales will be based on % Growth to Last Year. The solution must use the existing calculations only. How should you configure the visual? To answer, select the appropriate options in the answer area. NOTE: Each correct selection is worth one point. Hot Area: 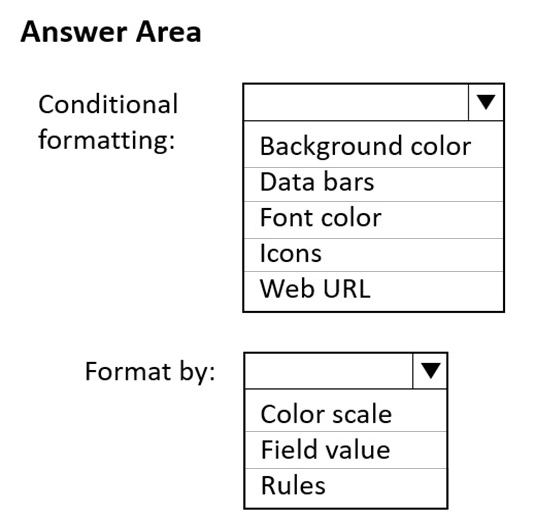 |
55. Click here to View Answer
Answer:
None
Box 1: Background color –
To apply conditional formatting, select a Table or Matrix visualization in Power BI Desktop. In the Visualizations pane, right-click or select the down-arrow next to the field in the Values well that you want to format. Select Conditional formatting, and then select the type of formatting to apply.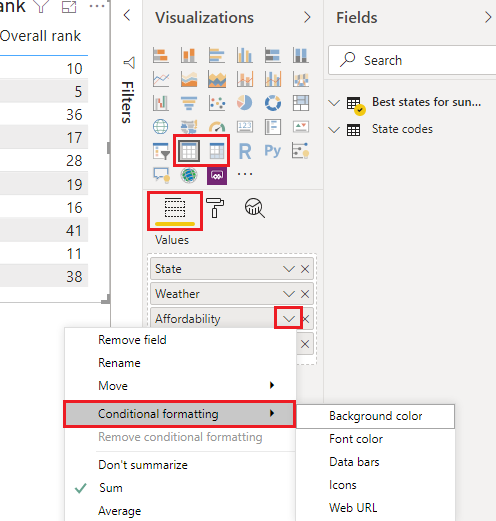
Box 2: Rules –
To format cell background or font color by rules, in the Format by field of the Background color or Font color dialog box, select Rules.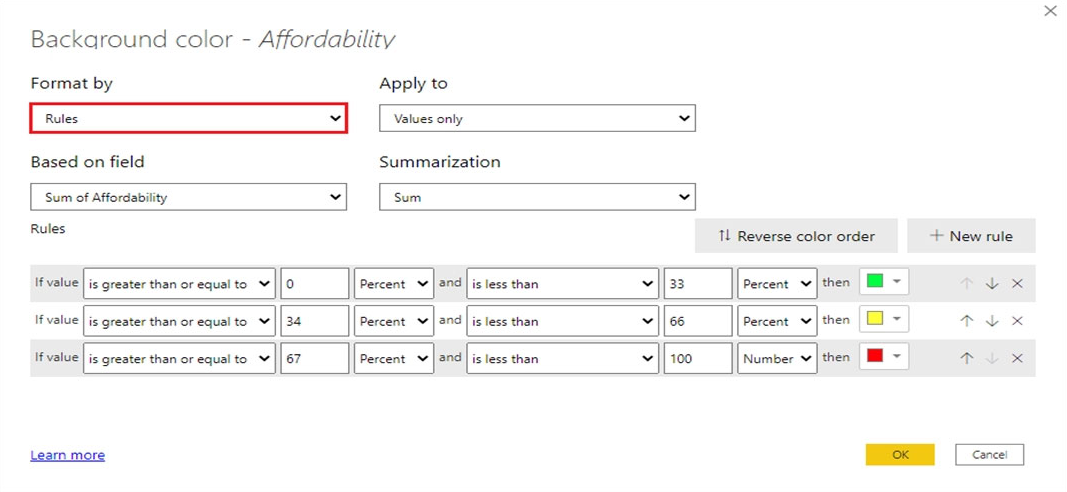
Reference:
https://docs.microsoft.com/en-us/power-bi/create-reports/desktop-conditional-table-formatting