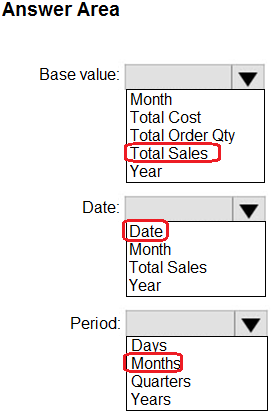
| Question 56 HOTSPOT You are creating a quick measure as shown in the following exhibit. 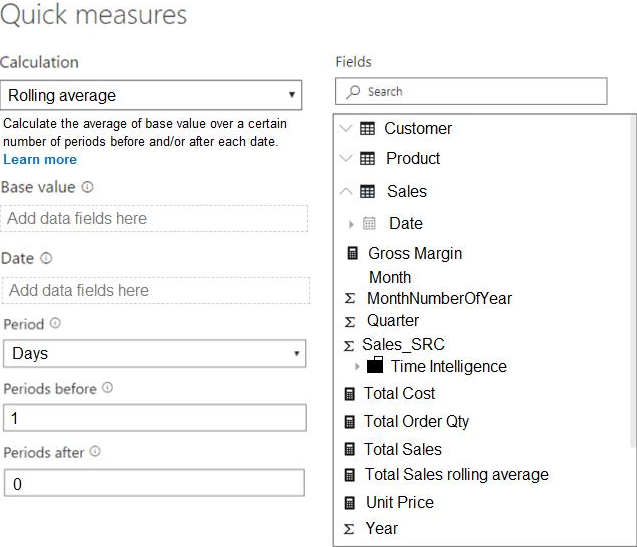 You need to create a monthly rolling average measure for Sales over time. How should you configure the quick measure calculation? To answer, select the appropriate options in the answer area. NOTE: Each correct selection is worth one point. 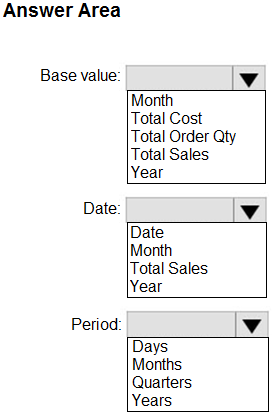 |
56. Click here to View Answer
Answer:
None
| Question 57 You have a Microsoft SQL Server Analysis Services (SSAS) cube that contains historical data. In Power BI Desktop, you have the following query for the cube.  The query retrieves 25,499 records. When you check the data warehouse that is the source of the cube, you discover that there are 26,423 records. You need to ensure that the query retrieves all 26,423 records. What should you do? A. From Query Editor, refresh all the data. B. Change the query to use Live connection mode. C. Delete the Remove Duplicates step. D. Add an Unpivot Columns step |
57. Click here to View Answer
Answer is C Delete the Remove Duplicates step.
Remove Duplicates step is added from FACT internet sales ‘CarrierTrackingNumber’ column
| Question 58 You plan to use Power BI Desktop to import 100 CSV files. The files contain data from different stores. The files have the same structure and are stored in a network share. You need to import the CSV files into one table. The solution must minimize administrative effort. What should you do? A. Add a folder data source and use the Combine Files command. B. Add a folder data source and use the Merge Queries command. C. Add a Microsoft Excel data source and use the Merge Queries command. D. Add text/CSV data sources and use the Append Queries command. |
58. Click here to View Answer
Answer is (A) Add a folder data source and use the Combine Files command.
Combine: It only appears in the case of the ‘Folder’ data source used to combine multiple files at one go
Append: Used when data already reside in Power query editor
Merge: It’s simply a join operation on tables resides in Power query editor
References:
https://docs.microsoft.com/en-us/power-bi/desktop-combine-binaries
| Question 59 You have the following two queries in Power BI Desktop: – A query named Query1 that retrieves a table named SMB_Customers from a Microsoft SQL Server database – A query named Query2 that retrieves a table named Enterprise_Customers from an Oracle Server database Both tables have the same columns. You need to combine the data from SMB_Customers and Enterprise_Customers. Which command should you use? A. Combine Files B. Merge Queries C. Merge Columns D. Append Queries |
59. Click here to View Answer
Answer is (D) Append Queries
Append is used for same structure table, combine vertically.
Merge is used for kinda like Vlookup function(via common column), combine horizontally to pull out the other table’s some column’s info, also could think of the RELATED function in DAX.
References:
http://radacad.com/append-vs-merge-in-power-bi-and-power-query
| Question 60 You have a Power BI model that contains sensor data from 500 sensors that return temperature readings each minute. Your reporting requirements contain the need to calculate the average temperature from each sensor at every hour. The reports do NOT show the raw data for each minute. You need to reduce the size of the model to improve performance. What should you do? A. Create visuals that group the data by hour. B. Use Power Query to group the sensor data by hour. C. And a report filter for the Hour column. D. Remove the rows that contain readings. |
60. Click here to View Answer
Answer : (B)