| Question 71 You have two tables named Customers and Invoice in a Power BI model. The Customers table contains the following fields: – CustomerID – Customer City – Customer State – Customer Name – Customer Address 1 – Customer Address 2 – Customer Postal Code The Invoice table contains the following fields: – Order ID – Invoice ID – Invoice Date – Customer ID – Total Amount – Total Item Count The Customers table is related to the Invoice table through the Customer ID columns. A customer can have many invoices within one month. The Power BI model must provide the following information: – The number of customers invoiced in each state last month – The average invoice amount per customer in each postal code You need to define the relationship from the Customers table to the Invoice table. The solution must optimize query performance. What should you configure? 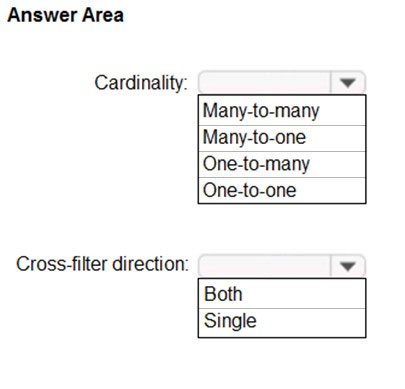 |
71. Click here to View Answer
Box 1: One-to-many
A customer can have many invoices within one month.
Box 2: Single
For One-to-many relationships, the cross filter direction is always from the “one” side, and optionally from the “many” side (bi-directional). For Single cross filter direction means “single direction”, and Both means “both directions”. A relationship that filters in both directions is commonly described as bi- directional.
Reference:
https://docs.microsoft.com/en-us/power-bi/transform-model/desktop-relationships-understand
| Question 72 You are creating a Microsoft Power BI data model that has the tables shown in the following table. 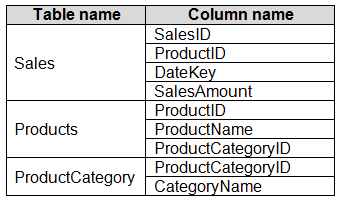 The Products table is related to the ProductCategory table through the ProductCategoryID column. You need to ensure that you can analyze sales by product category. How should you configure the relationships from Products to ProductCategory? 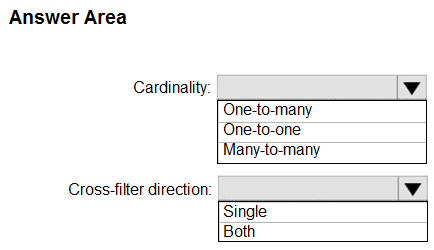 |
72. Click here to View Answer
Box 1: One-to-many
Box 2: Single
For One-to-many relationships, the cross filter direction is always from the “one” side, and optionally from the “many” side (bi-directional).
Reference:
https://docs.microsoft.com/en-us/power-bi/transform-model/desktop-relationships-understand
| Question 73 What turns a collection of independent tables into a data model? A. Connecting the tables via relationships, based on their common fields B. Connecting to the tables in a single Power BI file C. Merging the tables into a single “master” table D. Giving the tables related names |
73. Click here to View Answer
Answer is (A) Connecting the tables via relationships, based on their common fields
In a data model, tables are connected via relationships, based on their common fields
| Question 74 Which of these is NOT a data model best practice? A. Use a star schema with many-to-many relationships B. Contain relationships with one-way filters (vs. bidirectional) C. Contain tables that each serve a specific purpose, including data (fact) tables and lookup (dim) tables D. Only include the data you need for analysis (no redundant or unnecessary records or fields) |
74. Click here to View Answer
Answer is (A) Use a star schema with many-to-many relationships
A well designed model is critical and ideally should use a star schema with one-to-many (1:*) relationships, NOT many-to-many
| Question 75 Which of the following fields would typically find in a data table? A. Product name B. Retail price C. Quantity Sold D. Product Brand |
75. Click here to View Answer
Answer is (C) Quantity Sold
Data tables contain measurable metrics about the business, like quantity sold, while lookup tables provide descriptive attributes about each dimension in your model, like product name, product brand, and retail price.