| Question.21 What is a key benefit of data analysis? (A) Decisive analytics (B) Informed business decisions (C)Complex reports (D) All of these |
21. Click here to View Answer
Answer is (B) Informed business decisions
| Question .22 You import two Microsoft Excel tables named Customer and Address into Power Query. Customer contains the following columns: Customer ID Customer Name Phone Email Address Address ID Address contains the following columns: Address ID Address Line 1 Address Line 2 City State/Region Country Postal Code Each Customer ID represents a unique customer in the Customer table. Each Address ID represents a unique address in the Address table. You need to create a query that has one row per customer. Each row must contain City, State/Region, and Country for each customer. What should you do? A. Merge the Customer and Address tables. B. Group the Customer and Address tables by the Address ID column. C. Transpose the Customer and Address tables. D. Append the Customer and Address tables. |
22. Click here to View Answer
Answer:
a
A merge queries operation joins two existing tables together based on matching values from one or multiple columns. You can choose to use different types of joins, depending on the output you want.
Reference:
https://docs.microsoft.com/en-us/power-query/merge-queries-overview
| Question .23 You have a Power BI workspace named Inventory that contains a dataset, a report, and a dashboard. You need to add an additional tile to the dashboard. The tile must show inventory by location. This information is NOT visualized in the report. The solution must minimize the impact on the report. Which two actions should you perform? Each correct answer presents part of the solution. NOTE: Each correct selection is worth one point. A. Ask a question by using Q&A. B. Hide the report page. C. Pin the visual to the dashboard. D. Use quick insights on the dashboard. E. Add the visual to the report. |
23. Click here to View Answer
Answer: AC
In the Power BI service (app.powerbi.com), a dashboard contains tiles pinned from one or more datasets, so you can ask questions about any of the data contained in any of those datasets. T
The answer to your question is displayed as an interactive visualization and updates as you modify the question.
Open a dashboard and place your cursor in the question box. Even before you start typing, Q&A displays a new screen with suggestions to help you form your question. You see phrases and complete questions containing the names of the tables in the underlying datasets and may even see complete questions listed if the dataset owner has created featured questions,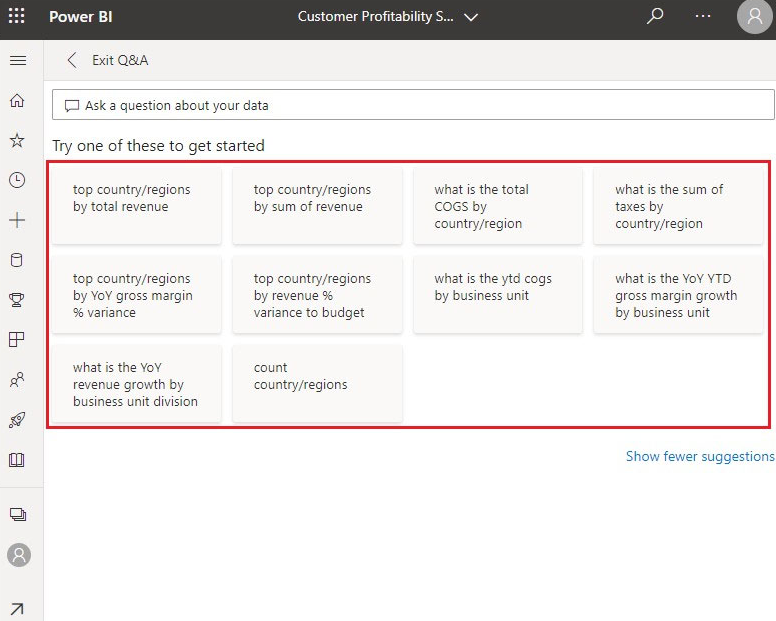
Reference:
https://docs.microsoft.com/en-us/power-bi/create-reports/power-bi-tutorial-q-and-a
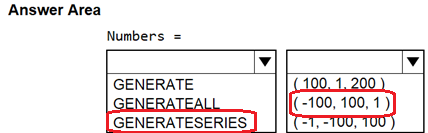
| Question 24 HOTSPOT You are creating a Power BI model in Power BI Desktop. You need to create a calculated table named Numbers that will contain all the integers from -100 to 100. How should you complete the DAX calculation? To answer, select the appropriate options in the answer area. NOTE: Each correct selection is worth one point. 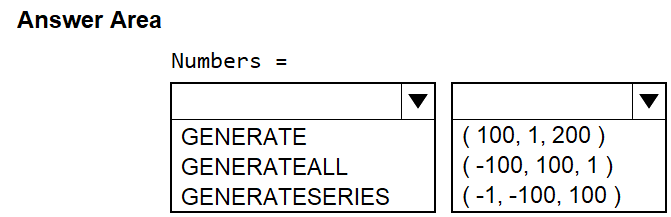 |
24. Click here to View Answer
Answer:
None
| Question 25 You are building a Power BI report to analyze customer segments. You need to identify customer segments dynamically based on the Bounce Rate across dimensions such as source, geography, and demographics. The solution must minimize analysis effort. Which type of visualization should you use? A. decomposition tree B. funnel chart C. Q&A D. key influencers |
25. Click here to View Answer
Answer: A
The decomposition tree visual in Power BI lets you visualize data across multiple dimensions. It automatically aggregates data and enables drilling down into your dimensions in any order. It is also an artificial intelligence (AI) visualization, so you can ask it to find the next dimension to drill down into based on certain criteria.
This makes it a valuable tool for ad hoc exploration and conducting root cause analysis.
Reference:
https://docs.microsoft.com/en-us/power-bi/visuals/power-bi-visualization-decomposition-tree