| Question 26 You attempt to connect Power BI Desktop to a Cassandra database. From the Get Data connector list, you discover that there is no specific connector for the Cassandra database. You need to select an alternate data connector that will connect to the database. Which type of connector should you choose? A. Microsoft SQL Server database B. ODBC C. OLE DB D. OData |
26. Click here to View Answer
Answer:
B
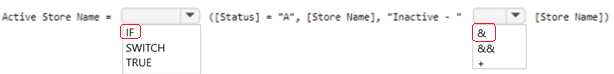
| Question 27 HOTSPOT You have a Power BI data model that contains a table named Stores. The table has the following columns: Store Name Open Date Status State City You need to create a calculated column named Active Store Name that meets the following requirements: When the value of the Status column is A, the value in the Store Name column must be returned. When the value of the Status column is NOT A, the value in the Store Name column that is prefixed with Inactive – must be returned. How should you complete the DAX expression? To answer, select the appropriate options in the answer area. NOTE: Each correct selection is worth one point. 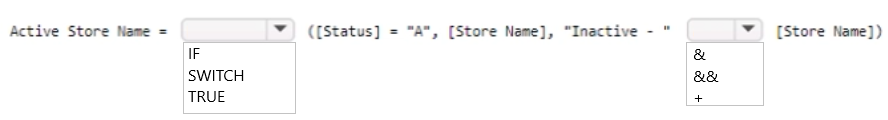 |
27. Click here to View Answer
Answer:
None
| Question 28 HOTSPOT You are creating a Microsoft Power BI imported data model to perform basket analysis. The goal of the analysis is to identify which products are usually bought together in the same transaction across and within sales territories. You import a fact table named Sales as shown in the exhibit. (Click the Exhibit tab.) 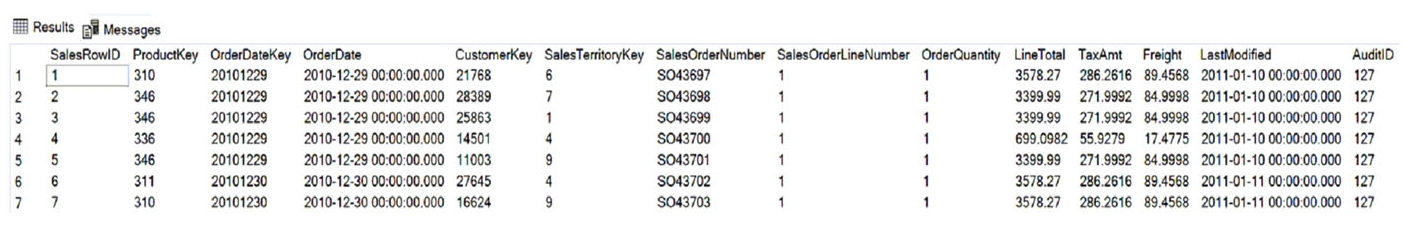 The related dimension tables are imported into the model. Sales contains the data shown in the following table. 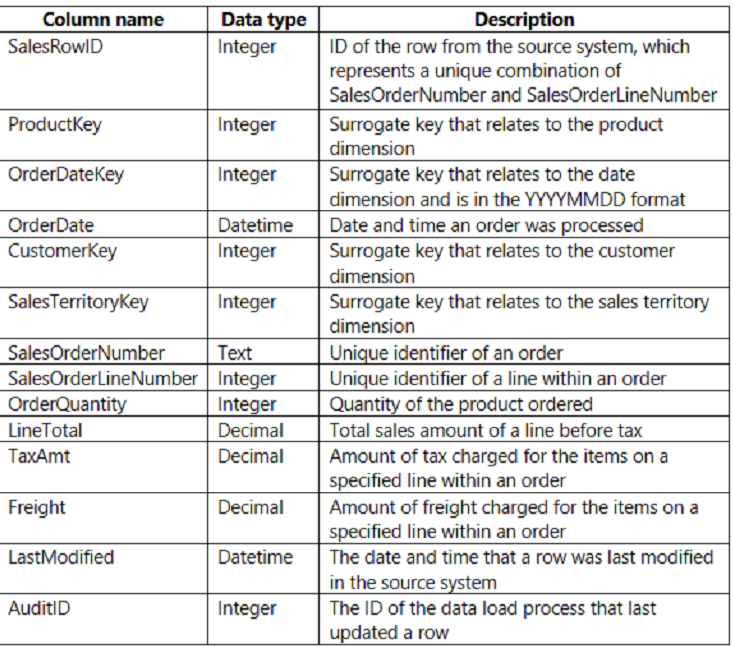 You are evaluating how to optimize the model. For each of the following statements, select Yes if the statement is true. Otherwise, select No. NOTE: Each correct selection is worth one point. Hot Area: 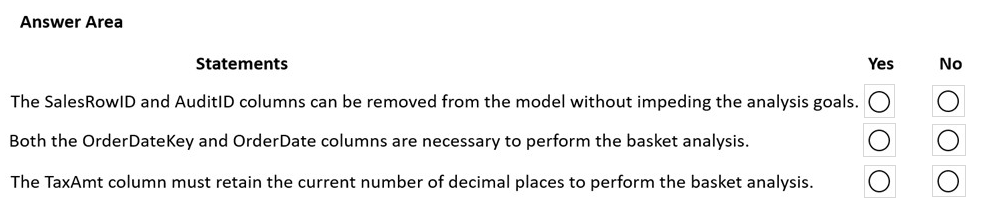 |
28. Click here to View Answer
Answer:
None
Box 1: Yes –
Those two columns not need in the analysis.
Box 2: No –
Can remove the surrogate key OrderDateKey from the analysis.
Box 3: No –
Tax charged not relevant for the analysis.
| Question 29 Note: This question is part of a series of questions that present the same scenario. Each question in the series contains a unique solution that might meet the stated goals. Some question sets might have more than one correct solution, while others might not have a correct solution. After you answer a question in this section, you will NOT be able to return to it. As a result, these questions will not appear in the review screen. You have a clustered bar chart that contains a measure named Salary as the value and a field named Employee as the axis. Salary is present in the data as a numerical amount representing US dollars. You need to create a reference line to show which employees are above the median salary. Solution: You create a constant line and set the value to .5. Does this meet the goal? A. Yes B. No |
29. Click here to View Answer
Answer: B
Instead: You create a percentile line by using the Salary measure and set the percentile to 50%.
The median is the middle value or the 50th percentile of a data set.
Reference:
https://dash-intel.com/powerbi/statistical_functions_median.php
| Question 30 HOTSPOT You need to create a measure that will return the percentage of late orders. How should you complete the DAX expression? To answer, select the appropriate options in the answer area. NOTE: Each correct selection is worth one point. Hot Area: 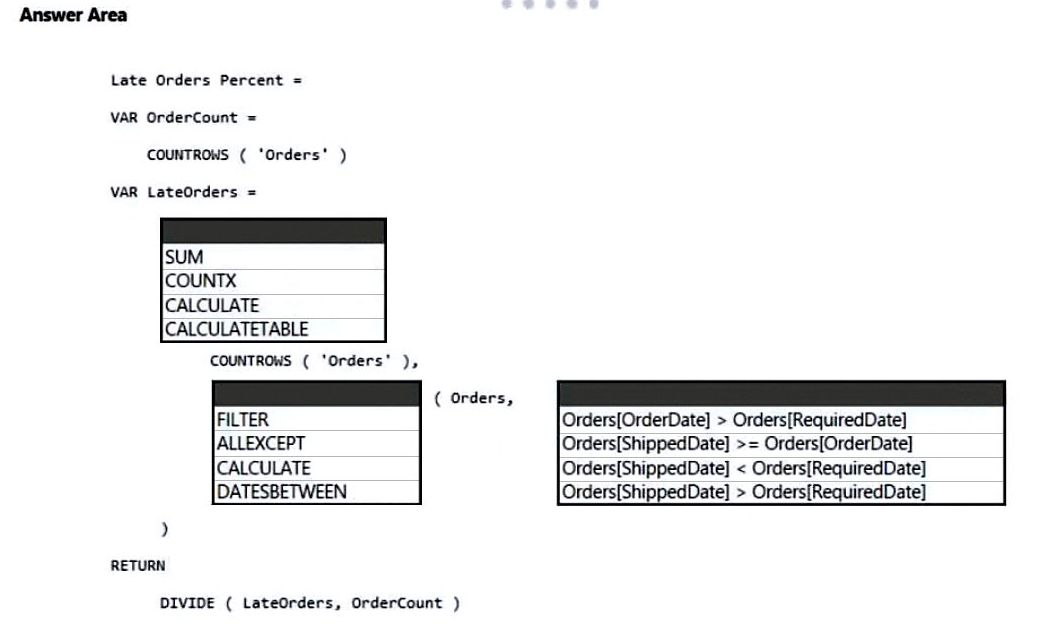 |
30. Click here to View Answer
Answer:
None
Box 1: CALCULATE –
CALCULATE evaluates an expression in a modified filter context.
Syntax: CALCULATE(<expression>[, <filter1> [, <filter2> [, ]]]) expression – The expression to be evaluated. filter1, filter2,.. – (Optional) Boolean expressions or table expressions that defines filters, or filter modifier functions.
Incorrect:
* COUNTX – Counts the number of rows that contain a non-blank value or an expression that evaluates to a non-blank value, when evaluating an expression over a table.
* CALCULATETABLE evaluates a table expression in a modified filter context.
Syntax: CALCULATETABLE(<expression>[, <filter1> [, <filter2> [, ]]])
Expression – The table expression to be evaluated.
Box 2: FILTER –
FILTER returns a table that represents a subset of another table or expression.
Syntax: FILTER(<table>,<filter>)
Box 3: Orders[ShippedDate] > Orders[RequiredDate]
Northwind Traders defines late orders as those shipped after the required shipping date.
Reference:
https://docs.microsoft.com/en-us/dax/calculate-function-dax
https://docs.microsoft.com/en-us/dax/filter-function-dax