| Question 31 You need to get data from the Microsoft SQL Server tables. What should you use to configure the connection? A. Import that uses a Microsoft account B. Import that uses a database credential C. DirectQuery that uses a database credential D. DirectQuery that uses the end-user’s credentials |
31. Click here to View Answer
Answer: D
Litware plans to leverage data from an Azure SQL database that stores data for the company’s live e-commerce website.
With DirectQuery, queries are sent back to your Azure SQL Database as you explore the data in the report view.
After you publish an Azure SQL DirectQuery dataset to the service, you can enable single sign-on (SSO) using Azure Active Directory (Azure AD) OAuth2 for your end users.
When the SSO option is enabled and your users access reports built atop the data source, Power BI sends their authenticated Azure AD credentials in the queries to the Azure SQL database or data warehouse. This option enables Power BI to respect the security settings that are configured at the data source level.
Reference:
https://docs.microsoft.com/en-us/power-bi/connect-data/service-azure-sql-database-with-direct-connect
| Question 32 In Power BI Desktop, you are creating a report that will contain three pages. You need to create a custom tooltip page and prepare the page for use. Which three actions should you perform? Each correct answer presents part of the solution. NOTE: Each correct selection is worth one point. A. For the tooltip page, set Allow use as tooltip to On. B. For the target page, set Allow use as tooltip to On. C. Configure filters on the target visual. D. For the tooltip page, configure filters. E. Add and configure visuals on the tooltip page. |
32. Click here to View Answer
Answer: BCE
| Question 33 DRAG DROP You have a Power BI dashboard named DashboardA that contains a tile named TileA. TileA contains a treemap visual from a report named ReportA. You need to provide the users of DashboardA with additional tiles that relate to the contents of TileA. Which three actions should you perform in sequence? To answer, move the appropriate actions from the list of actions to the answer area and arrange them in the correct order. Select and Place:  |
33. Click here to View Answer
Answer:
None
Step 1: From ReportA, select Get Insights
Then select ‘Get Insights’ From the Datasets + dataflows tab, select More options (…) next to the dataset, and then choose Get insights.
Power BI Quick Insights will now scan the data related to the tile and display a list of potential insights you may want to explore further. To drill into a specific data point, you can even select data in the visual and Quick Insights will focus on that data point when searching for insights.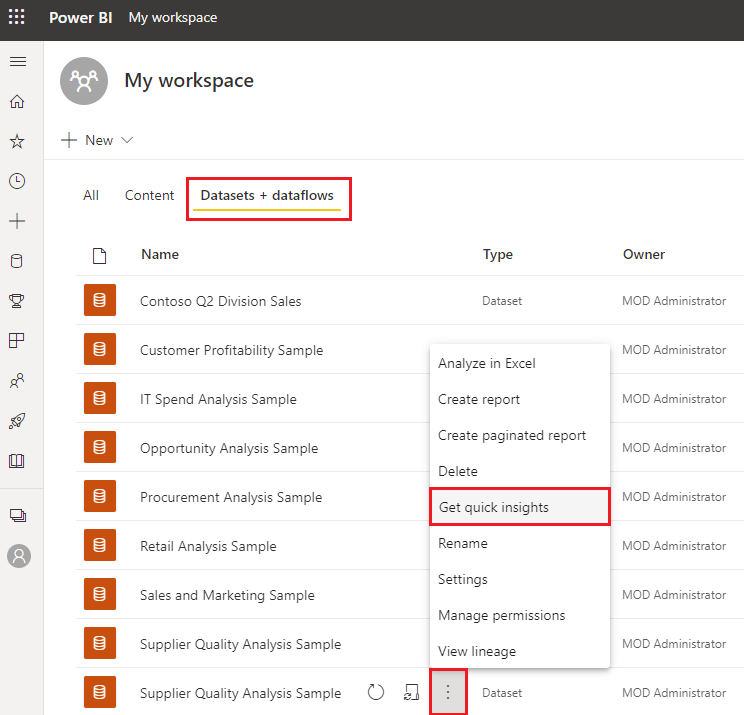
Power BI uses various algorithms to search for trends in your dataset.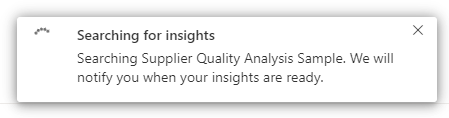
Within seconds, your insights are ready. Select View insights to display visualizations.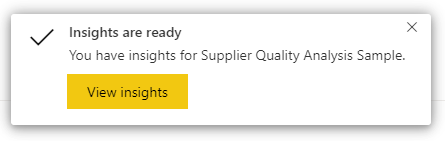
The visualizations display in a special Quick Insights canvas with up to 32 separate insight cards. Each card has a chart or graph plus a short description.
Step 2: From DashboardA, select the TileA options, and then select View Insights
The insight screen opens in Focus mode.
Step 3: From Focus mode, pin the relevant visuals to DashboardA
Go to ‘in focus mode’ on a dashboard tile for data loaded into Power BI.
Reference:
https://docs.microsoft.com/en-us/power-bi/create-reports/service-insights
| Question 34 DRAG DROP You have a Microsoft Excel workbook that contains two sheets named Sheet1 and Sheet2. Sheet1 contains the following table named Table1. 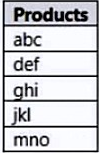 Sheet2 contains the following table named Table2.  You need to use Power Query Editor to combine the products from Table1 and Table2 into the following table that has one column containing no duplicate values. 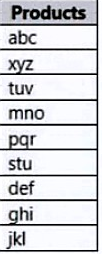 Which three actions should you perform in sequence? To answer, move the appropriate actions from the list of actions to the answer area and arrange them in the correct order. Select and Place: 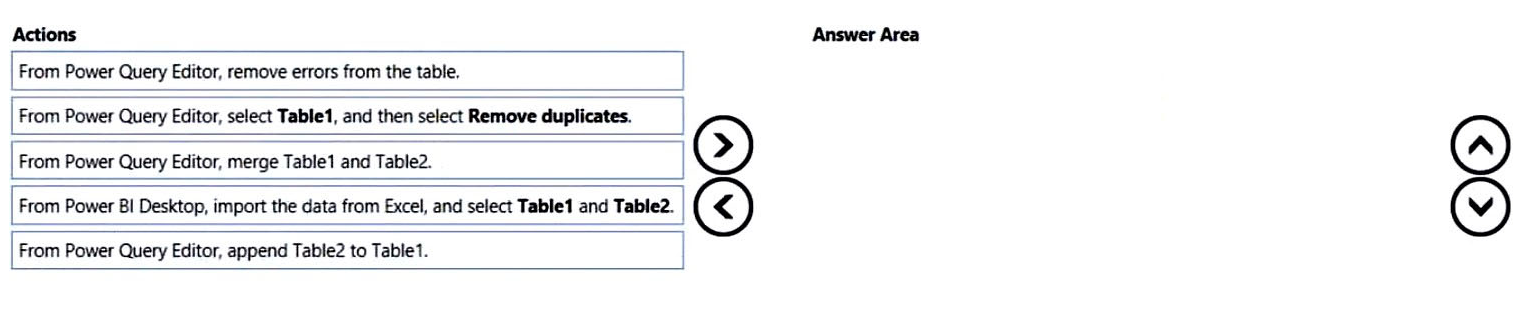 |
34. Click here to View Answer
Answer:
None
Reference:
https://docs.microsoft.com/en-us/power-bi/connect-data/desktop-shape-and-combine-data
| Question 35 You have a CSV file that contains user complaints. The file contains a column named Logged. Logged contains the date and time each complaint occurred. The data in Logged is in the following format: 2018-12-31 at 08:59. You need to be able to analyze the complaints by the logged date and use a built-in date hierarchy. What should you do? A. Create a column by example that starts with 2018-12-31 and set the data type of the new column to Date B. Create a column by example that starts with 2018-12-31 C. Apply a transformation to extract the last 11 characters of the Logged column D. Add a conditional column that outputs 2018 if the Logged column starts with 2018 and set the data type of the new column to Whole Number |
35. Click here to View Answer
Answer: D