| Question 36 HOTSPOT You have the Power BI data model shown in the following exhibit. 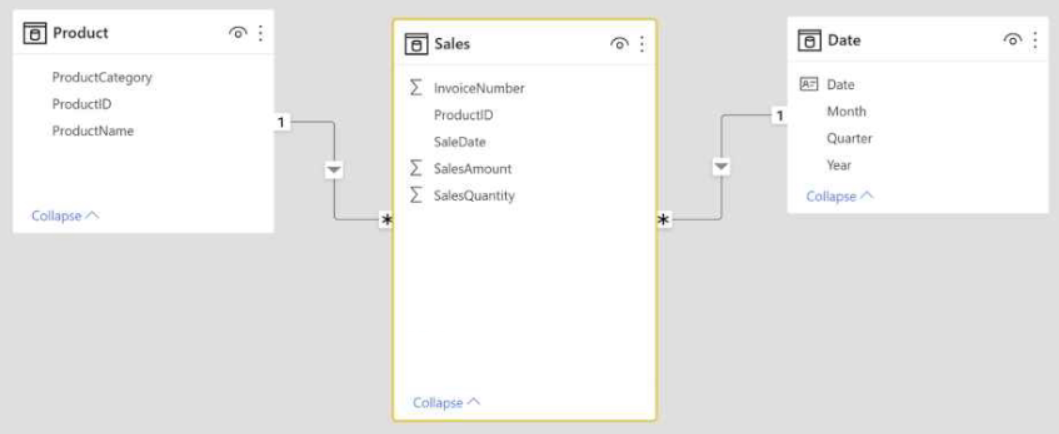 You need to create a measure to count the number of product categories that had products sold during a selected period. How should you complete the DAX expression? To answer, select the appropriate options in the answer area. NOTE: Each correct selection is worth one point. 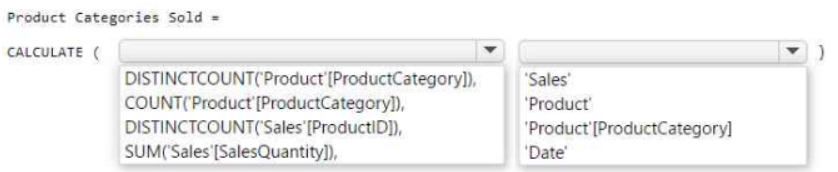 |
36. Click here to View Answer
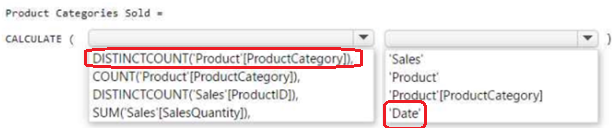
Answer:
None
| Question 37 You need to create the dataset. Which dataset mode should you use? A. Import B. DirectQuery C. Composite D. live connection |
37. Click here to View Answer
Answer: C
The three dataset modes are:
Import –
DirectQuery –
Composite –
Composite mode –
Composite mode can mix Import and DirectQuery modes, or integrate multiple DirectQuery data sources. Models developed in Composite mode support configuring the storage mode for each model table. This mode also supports calculated tables (defined with DAX).
The table storage mode can be configured as Import, DirectQuery, or Dual. A table configured as Dual storage mode is both Import and DirectQuery, and this setting allows the Power BI service to determine the most efficient mode to use on a query-by-query basis.
Note: A single dataset must support all three reports.
The data model must minimize the size of the dataset as much as possible, while meeting the report requirements and the technical requirements.
Northwind Traders requires the following reports:
Top Products –
Top Customers –
On-Time Shipping –
Incorrect:
* DirectQuery mode is an alternative to Import mode. Models developed in DirectQuery mode don’t import data. Instead, they consist only of metadata defining the model structure. When the model is queried, native queries are used to retrieve data from the underlying data source.
* Import
However, while there are compelling advantages associated with Import models, there are disadvantages, too:
The entire model must be loaded to memory before Power BI can query the model, which can place pressure on available capacity resources, especially as the number and size of Import models grow
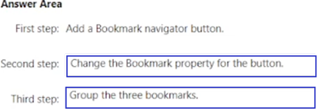
| Question 38 DRAG DROP You have a Power BI report that contains five bookmarks. You need to add an object to the report from which users can navigate between three specific bookmarks. How should you complete the task? To answer, drag the appropriate actions to the correct steps. Each action may be used once, more than once, or not at all. You may need to drag the split bar between panes or scroll to view content. NOTE: Each correct selection is worth one point. 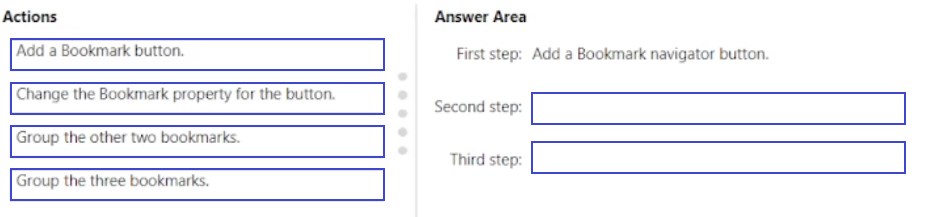 |
38. Click here to View Answer
Answer:
None
| Question 39 HOTSPOT How should you distribute the reports to the board? To answer, select the appropriate options in the answer area. NOTE: Each correct selection is worth one point. Hot Area: 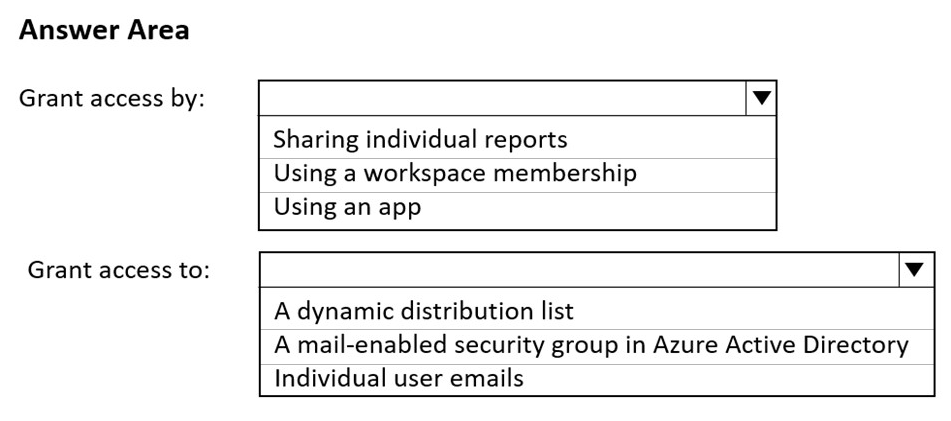 |
39. Click here to View Answer
Answer:
None
Box 1: Using a workspace membership
Note 1: The company wants to provide the board with a single package of reports that will contain custom navigation and links to supplementary information.
Sharing is the easiest way to give people access to your reports and dashboards in the Power BI service. You can share with people inside or outside your organization.
Where you can share:
You can share reports and dashboards from My Workspace.
You can share from workspaces other than My Workspace, if you have the Admin or Member role in the workspace. If you have the Contributor or Viewer role, you can share if you have Reshare permissions.
You can share from the Power BI mobile apps.
You can’t share directly from Power BI Desktop.
Box 2: A mail-enabled security group in Azure Active Directory
Mail-Enabled Security Group –
This group also contains a list of email addresses of members and can also be used to control access to OneDrive and SharePoint.
The Mail-Enabled Security Group can be created in the Office 365 Admin Portal
Note: The reports must be made available to the board from powerbi.com. An Azure Active Directory (Azure AD) group will be used to share information with the board.
Incorrect:
* Distribution Group
This group can also be called and Distribution List. The Distribution Group is a group which contains a list of email addresses of members, all of whom will be sent an email when an email is sent to the distribution groups email address.
The Distribution Group can be created in the Azure Active Directory
Reference:
https://docs.microsoft.com/en-us/power-bi/collaborate-share/service-share-dashboards https://www.fourmoo.com/2020/04/01/power-bi-which-groups-can-be-used-to-set-permissions-in-power-bi/
| Question 40 You need to minimize the size of the dataset. The solution must meet the report requirements. What should you do? A. Group the Categories table by the CategoryID column. B. Remove the QuantityPerUnit column from the Products table. C. Filter out discontinued products while importing the Products table. D. Change the OrderID column in the Orders table to the Text data type. |
40. Click here to View Answer
Answer: B
Removing a column which isn’t used in the reports reduces the dataset size.
Incorrect:
Not A: Grouping does not affect size.
Not C: Cannot filter out discontinued products as: The reports must show historical data for the current calendar year and the last three calendar years.
Not D: OrderID must be Integer.