| Question 41 You have a Power BI model that contains a table named Employee. The table contains the following data. 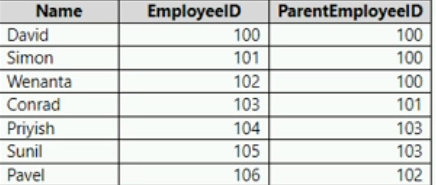 Each employee has one manager as shown in the ParentEmployeeID column. All reporting paths lead to the CEO at the top of the organizational hierarchy. You need to create a calculated column that returns the count of levels from each employee to the CEO. Which DAX expression should you use? A. PATHLENGTH(PATH(Employee[EmployeeID],Employee[ParentEmployeeID])) B. PATHITEM(PATH(Employee[EmployeeID],Employee[ParentEmployeeID]),1,INTEGER) C. PATHCONTAINS(PATH(Employee[EmployeeID],Employee[ParentEmployeeID]),1) D. PATH(Employee[EmployeeID],Employee[ParentEmployeeID]) |
41. Click here to View Answer
Answer: A
| Question 42 You need to create a Power BI theme that will be used in multiple reports. The theme will include corporate branding for font size, color, and bar chart formatting. What should you do? A. From Power BI Desktop, customize the current theme. B. From Power BI Desktop, use a built-in report theme. C. Create a theme as a PBIVIZ file and import the theme into Power BI Desktop. D. Create a theme as a JSON file and import the theme into Power BI Desktop. |
42. Click here to View Answer
Answer: A
| Question 43 You have a CSV file that contains user complaints. The file contains a column named Logged. Logged contains the date and time each complaint occurred. The data in Logged is in the following format: 2018-12-31 at 08:59. You need to be able to analyze the complaints by the logged date and use a built-in date hierarchy. What should you do? A. Apply a transformation to extract the first 11 characters of the logged column. B. Add a conditional column that outputs 2018 if the Logged column starts with 2018 and set the data type of the new column to Whole Number. C. Create a column by example that starts with 2018-12-31 and set the data type of the new column to Date. D. Apply a transformation to extract the last 11 characters of the Logged column and set the data type of the new column to Date. |
43. Click here to View Answer
Answer: B
| Question 44 DRAG DROP You receive revenue data that must be included in Microsoft Power BI reports. You preview the data from a Microsoft Excel source in Power Query as shown in the following exhibit. 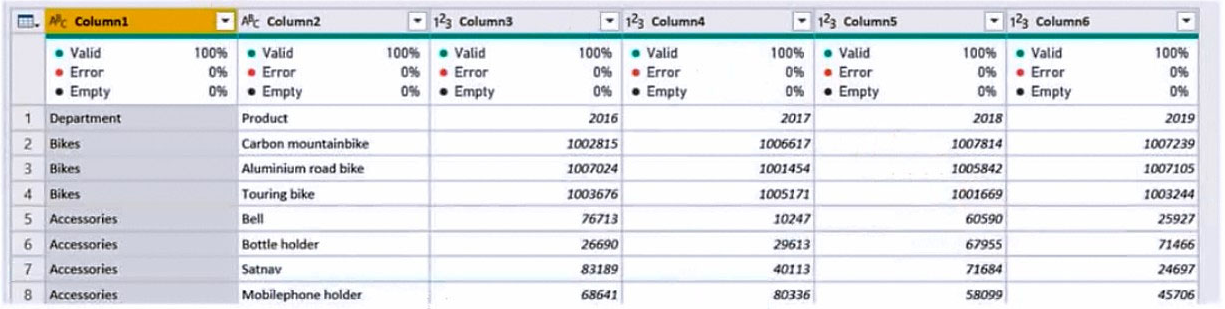 You plan to create several visuals from the data, including a visual that shows revenue split by year and product. You need to transform the data to ensure that you can build the visuals. The solution must ensure that the columns are named appropriately for the data that they contain. Which three actions should you perform in sequence? To answer, move the appropriate actions from the list of actions to the answer area and arrange them in the correct order. Select and Place: 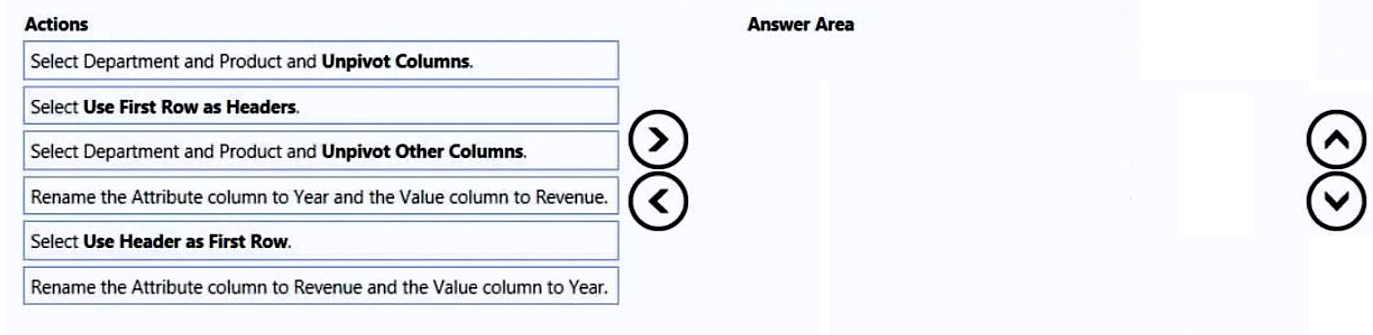 |
44. Click here to View Answer
Answer:
None
Step 1: Select Department and Product and Unpivot Other Columns
The Unpivot Other Columns command unpivots unselected columns. Use this command in a query when not all columns are known. New columns added during a refresh operation are also unpivoted.
Note: Unpivot columns: In Power Query, you can transform columns into attribute-value pairs, where columns become rows.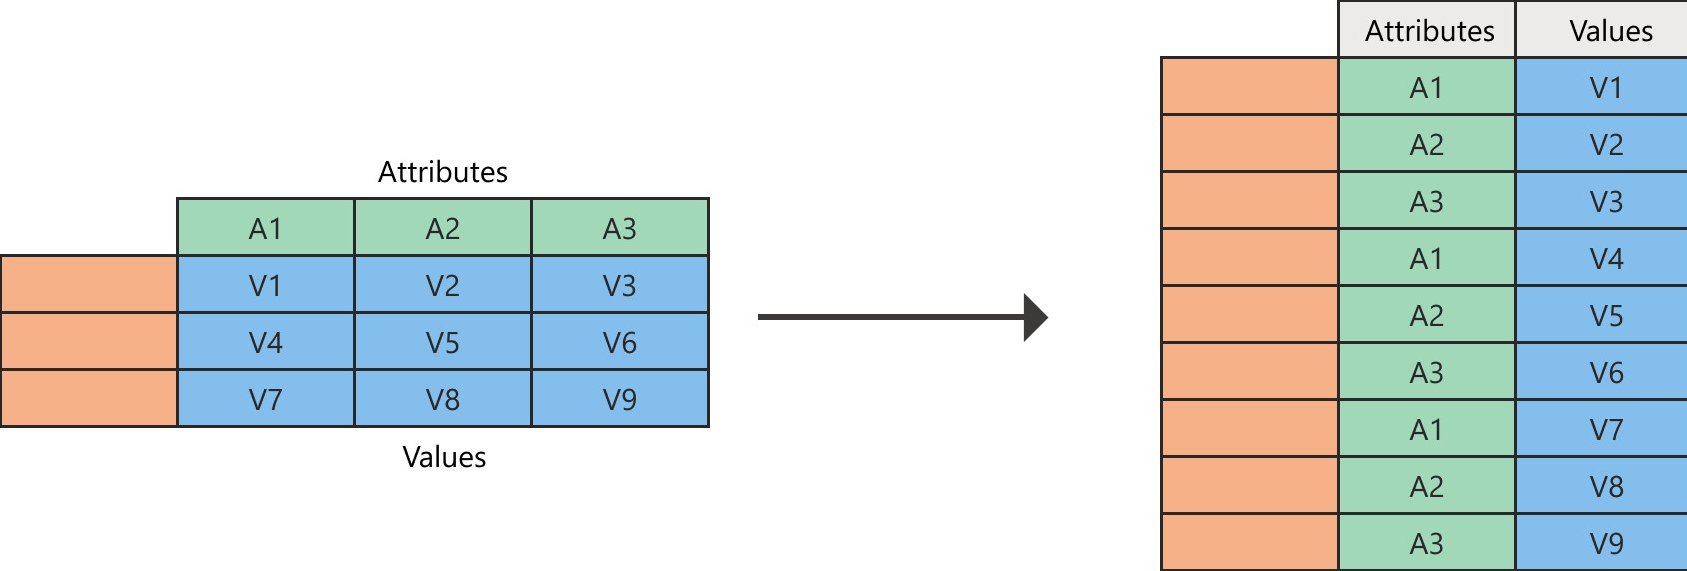
Step 2: Rename the Attribue column to Year and the Value Column to Revenue
Need to do this after the unpivot.
Power Query will always create the attribute-value pair by using two columns:
Attribute: The name of the column headings that were unpivoted.
Value: The values that were underneath each of the unpivoted column headings.
Step 3: Select Use the First Row as Headers
Reference:
https://docs.microsoft.com/en-us/power-query/unpivot-column
| Question 45 You have a report that contains a bar chart and a column chart. The bar chart shows customer count by customer segment. The column chart shows sales by month. You need to ensure that when a segment is selected in the bar chart, you see which portion of the total sales for the month belongs to the customer segment. How should the visual interactions be set on the column chart when the bar chart is selected? A. highlight B. filter C. no impact |
45. Click here to View Answer
Answer: A
In most visuals, highlighting doesn’t remove the unrelated data. Instead it highlights the related data. The rest of the data remains visible but dimmed.
Note: By default, visualizations on a report page can be used to cross-filter and cross-highlight the other visualizations on the page. For example, selecting a state on a map visualization highlights the column chart and filters the line chart to display only data that applies to that one state.
Incorrect:
Not B: Filters remove all but the data you want to focus on.
Reference:
https://docs.microsoft.com/en-us/power-bi/create-reports/power-bi-reports-filters-and-highlighting